
PL-300 Exam Prep Part 3 | DAX & Power Query Fundamentals (Q51-75)
Sharpen your Power BI skills for the PL-300 certification. This practice set (Q51-75) covers the core of data modeling: essential DAX calculations, Power Query transformations, and data profiling techniques.
Question 51:
Note: This question is part of a series of questions that present the same scenario.
You have a clustered bar chart that contains a measure named Salary as the value and a field named Employee as the axis. Salary is present in the data as a numerical amount representing US dollars. You need to create a reference line to show which employees are above the median salary.
Solution: You create an average line by using the Salary measure.
Does this meet the goal?
- A. Yes
- B. No
Question 52:
Note: This question is part of a series of questions that present the same scenario.
You have a clustered bar chart that contains a measure named Salary as the value and a field named Employee as the axis. Salary is present in the data as a numerical amount representing US dollars. You need to create a reference line to show which employees are above the median salary.
Solution: You create a constant line and set the value to .5.
Does this meet the goal?
- A. Yes
- B. No
Question 53:
You have a Power BI model that contains a table named Sales. The Sales table contains multiple columns including Order ID. Orders are uniquely identified by using the order ID and can have multiple order lines. You need to write a DAX measure that counts the number of orders. Which formula should you use?
- A. Count(‘Sales'[Order ID])
- B. CountA(‘Sales'[Order ID])
- C. CountRows(‘Sales’)
- D. DistinctCount(‘Sales'[Order ID])
Question 54:
HOTSPOT – You are creating a Power BI model in Power BI Desktop. You need to create a calculated table named Numbers that will contain all the integers from -100 to 100. How should you complete the DAX calculation?
Numbers = [Function]([Start], [End], [Increment])
- Function: [Option]
- Start: [Option]
- End: [Option]
- Increment: [Option]
Question 55:
In Power Query Editor, you have a query named Sales Data. You need to create two queries named Product Dimension and Sales Fact based on the Sales Data query. The solution must minimize maintenance effort and the size of the dataset. Which two actions should you perform?
- A. Reference the Sales Data query to create the new queries.
- B. Disable the load for the Sales Fact query.
- C. Duplicate the Sales Data query to create the new queries.
- D. Clear Include in report refresh for the Sales Data query.
- E. Disable the load for the Sales Data query.
Question 56:
You have a Power BI model that contains a table named Date. You need to create a calculated table based on the Date table. The calculated table must contain only unique combinations of values for Calendar Year, Calendar Quarter, and Calendar Month. Which DAX function should you include in the table definition?
- A. ADDCOLUMNS
- B. CALCULATE
- C. SUMMARIZE
- D. DATATABLE
Question 57:
HOTSPOT – You have a Power BI model that contains data as shown. The Date table relates to the Sales table by using the Date columns. You need to create a calculated table that will contain:
– A row for each year
– A column that contains the total sales per year
How should you complete the DAX calculation?
SalesByYear = [Function1]([Table], [GroupByColumn], "[NewColumnName]", [Expression])
- Function1: [Option]
- GroupByColumn: [Option]
- Expression: [Option]
Question 58:
You use Power Query Editor to import and preview sales data from a Microsoft Excel file as shown in the exhibit, where years are in columns. You need to shape the query to display the following three columns: Month, Sales, Year. What should you select in Power Query Editor?
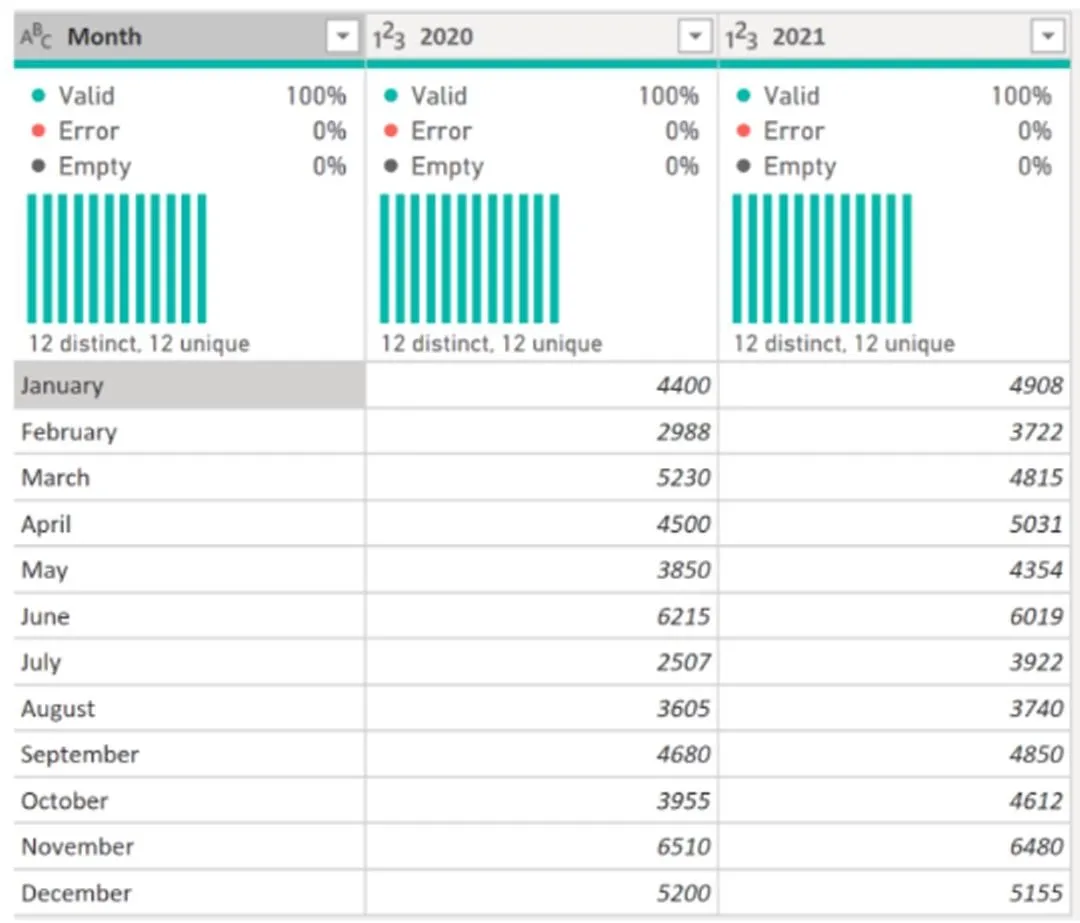
- A. Merge columns
- B. Transpose
- C. Unpivot columns
- D. Pivot column
Question 59:
HOTSPOT – You are creating a Power BI model to analyze inventory. The correct inventory quantity for a given product in a month is the last recorded value for that month. You need to write a DAX measure that will show the correct inventory value when a user analyzes inventory by year, month, or date. How should you complete the measure?
Ending Inventory = CALCULATE( SUM(Inventory[Quantity]), [Function]('Date'[Date]) )
- Function: [Option]
Question 60:
Note: This question is part of a series of questions that present the same scenario.
You have a Power BI report that imports a date table and a sales table. The sales table has three date foreign keys: Due Date, Order Date, Delivery Date. You need to support the analysis of sales over time based on all three dates at the same time.
Solution: From the Fields pane, you rename the date table as Due Date. You use a DAX expression to create Order Date and Delivery Date as calculated tables. You create active relationships between the sales table and each date table.
Does this meet the goal?
- A. Yes
- B. No
Question 61:
HOTSPOT – You are creating a Power BI report that will show the number of current employees over time from a monthly snapshot table. You need to create a semi-additive DAX measure that will return the count of employees for the last available date in a year, quarter, or month. How should you complete the measure?
Employee Count = [Function1]( [Function2](Headcount[EmployeeID]), [Function3]('Date'[Date]) )
- Function1: [Option]
- Function2: [Option]
- Function3: [Option]
Question 62:
HOTSPOT – You have a query named All Sales that imports sales data into a Power BI model. You plan to create a star schema by separating columns into separate queries. The solution must use All Sales as the source for three other queries named Sales Fact, Product Dimension, and Customer Dimension, and minimize maintenance effort. What should you do to create the Sales Fact query, and for which query should you clear Enable load?
- To create the Sales Fact query, you should: [Option]
- Clear Enable load for: [Option]
Question 63:
You have a Microsoft Power BI report with a 550 MB PBIX file size. The report is on a single page with 25 visuals. Users say that the report is slow to load and interact with. You need to recommend a solution to improve the performance. What should you recommend?
- A. Change any DAX measures to use iterator functions.
- B. Implement row-level security (RLS).
- C. Replace the default visuals with AppSource visuals.
- D. Split the visuals onto multiple pages.
Question 64:
You are reviewing a Power BI data model. You have a calculated table that has the following definition:
ProductList = INTERSECT ( ProductsGroupA, ProductsGroupB )
You need to identify the results of the DAX expression. Which rows will be returned in ProductList?
- A. all the rows in ProductsGroupB that have a matching row in ProductsGroupA
- B. all the rows in both tables
- C. all the rows in ProductsGroupA that have a matching row in ProductsGroupB
- D. all the rows in ProductsGroupA that have no matching row in ProductsGroupB.
Question 65:
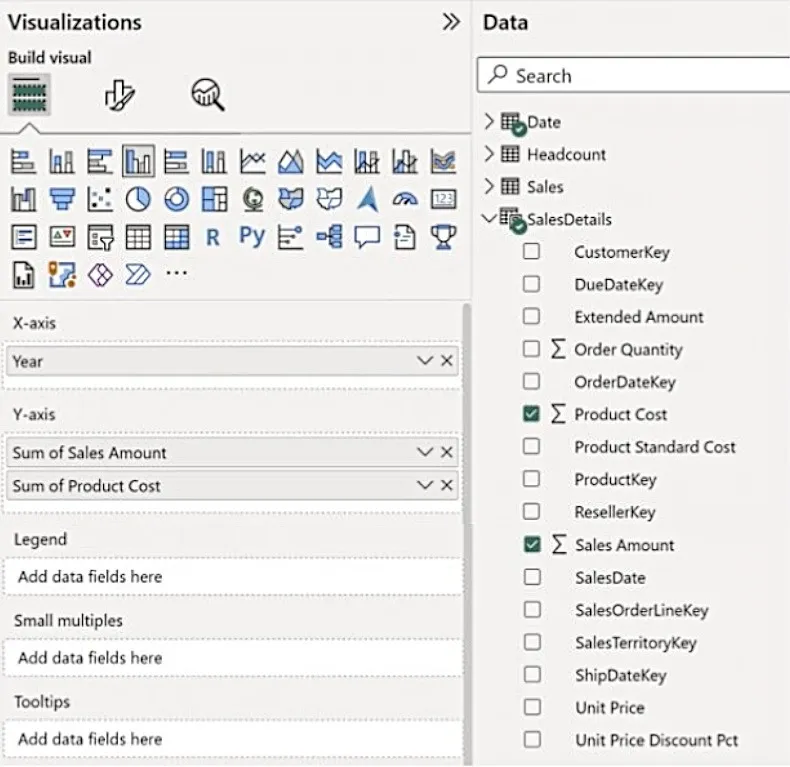
You have a Power BI data model that contains two tables named Sales and Date. The Sales table contains three measures named Order Quantity, Product Cost, and Sales Amount. You need to create a matrix visual. In which section of the Fields well should you place the measures?
- A. Columns
- B. Rows
- C. Values
- D. Drill through
Question 66:
HOTSPOT – You have Power BI report that contains the fields shown in the exhibit. Use the drop-down menus to select the answer choice that completes each statement based on the information presented in the graphic.
- To enable drill-down from Country to State to City, you should create a: [Option]
- To ensure locations are mapped correctly, you should set the: [Option]
Question 67:
Question text not available in the provided document.
Question 68:
You have a Power BI model that contains a table named Employees with columns for Employee ID, Department, and Salary. You need to create a DAX measure that will calculate the average salary of all the employees in the sales department. Which DAX expression should you use?
- A. DISTINCTCOUNT(‘Employees’[Salary])
- B. CALCULATE(DISTINCTCOUNT(‘Employees’[Salary]), ‘Employees’[Department] = “Sales”)
- C. CALCULATE(AVERAGE(‘Employees’[Salary]), ‘Employees’[Department] = “Sales”)
- D. AVERAGE(‘Employees’[Salary])
Question 69:
You use Power Query Editor to preview a query that contains sales order data. The Tax Amount and Freight Amount columns are sometimes null. You need to query the data to identify metrics, including the average freight amount per order. How should you modify the query?
- A. In the Total Item Quantity column, replace the null values with 0.
- B. In the Tax Amount column, remove rows that contain null values.
- C. In the Freight Amount column, remove rows that contain null values.
- D. In the Freight Amount column, replace the null values with 0.
Question 70:
You have a Power BI data model that analyzes product sales over time. The auto date/time option for the data model is enabled. You need to reduce the size of the data model while maintaining the ability to analyze product sales by month and quarter. Which two actions should you perform?
- A. Create a relationship between the Date table and the Sales table.
- B. Disable the auto date/time option.
- C. Create a Date table and select Mark as Date Table.
- D. Disable the load on the Date table.
- E. Remove the relationship between the Product table and the Sales table.
Question 71:
You have a Microsoft Power BI report with a 550 MB PBIX file size. Users say that the report is slow. You need to recommend a solution to improve the performance. What should you recommend?
- A. Implement row-level security (RLS).
- B. Remove unused columns from tables in the data model.
- C. Replace the default visuals with AppSource visuals.
- D. Enable visual interactions.
Question 72:
HOTSPOT – You have a Power BI data model that contains a table named Stores. You need to create a calculated column named Active Store Name that meets the following requirements:
– When the value of the Status column is “A”, the value in the Store Name column must be returned.
– When the value of the Status column is NOT “A”, the value in the Store Name column that is prefixed with “Inactive – ” must be returned.
How should you complete the DAX expression?
Active Store Name = [Function](Stores[Status]="A", Stores[Store Name], "Inactive - " [Operator] Stores[Store Name])
- Function: [Option]
- Operator: [Option]
Question 73:
You have a CSV file that contains user complaints. The file contains a column named Logged, with data in the format: 2018-12-31 at 08:59. You need to be able to analyze the complaints by the logged date and use a built-in date hierarchy. What should you do?
- A. Apply a transformation to extract the first 11 characters of the logged column.
- B. Add a conditional column that outputs 2018 if the Logged column starts with 2018 and set the data type of the new column to Whole Number.
- C. Create a column by example that starts with 2018-12-31 and set the data type of the new column to Date.
- D. Apply a transformation to extract the last 11 characters of the Logged column and set the data type of the new column to Date.
Question 74:
Note: This question is part of a series of questions that present the same scenario.
From Power Query Editor, you profile the data from an IoT source. You need to analyze IoT events by the hour and day of the year. The solution must improve dataset performance.
Solution: You create a custom column that concatenates the IoT GUID column and the IoT ID column and then delete the IoT GUID and IoT ID columns.
Does this meet the goal?
- A. Yes
- B. No
Question 75:
You have a Power BI model that contains an Employee table with EmployeeID and ParentEmployeeID, forming an organizational hierarchy. You need to create a calculated column that returns the count of levels from each employee to the CEO. Which DAX expression should you use?
- A. PATHLENGTH(PATH(Employee[EmployeeID],Employee[ParentEmployeeID]))
- B. PATHITEM(PATH(Employee[EmployeeID],Employee[ParentEmployeeID]),1,INTEGER)
- C. PATHCONTAINS(PATH(Employee[EmployeeID],Employee[ParentEmployeeID]),1)
- D. PATH(Employee[EmployeeID],Employee[ParentEmployeeID])
Ready for Offline Study?
Get the complete PL-300 question bank with detailed answers as a downloadable PDF to supercharge your exam prep.
Download Complete PDFFrequently Asked Questions (FAQ) about DAX and Power Query
1. What is the difference between a calculated column and a measure in DAX?
A calculated column is computed once during data refresh and stored physically in the model, consuming memory. A measure is calculated on-the-fly at query time based on the current filter context (slicers, visuals) and does not store data in the model.
2. When should I use Power Query transformations instead of DAX?
Use Power Query for data shaping and preparation tasks that need to happen before the data is loaded, such as cleaning data, removing columns/rows, unpivoting, and merging tables. Use DAX for dynamic calculations and aggregations within the report itself.
3. What is the most important DAX function to know for the PL-300 exam?
While many are important, the `CALCULATE` function is arguably the most critical. It allows you to modify the filter context of any calculation, making it the foundation for most advanced and useful measures in Power BI.