
PL-300 Power BI Exam: Security, Case Studies & Advanced Topics (Part 8)
This is the final review for your PL-300 exam. This comprehensive practice set tests your ability to apply knowledge in real-world scenarios with case studies, advanced security features, and complex troubleshooting questions.
Case Study 2: Contoso, Ltd. (continued)
Question 8 (CS2):
Which two types of visualizations can be used in the balance sheet reports to meet the reporting goals (e.g., show changes in long-term liabilities from the previous quarter)? Each correct answer presents part of the solution.
- A. a line chart that shows balances by quarter filtered to account categories that are long-term liabilities.
- B. a clustered column chart that shows balances by date (x-axis) and account category (legend) without filters.
- C. a clustered column chart that shows balances by quarter filtered to account categories that are long-term liabilities.
- D. a pie chart that shows balances by account category without filters.
- E. a ribbon chart that shows balances by quarter and accounts in the legend.
Question 9 (CS2):
What is the minimum number of datasets and storage modes required to support all the reports for Contoso?
- A. two imported datasets
- B. a single DirectQuery dataset
- C. two DirectQuery datasets
- D. a single imported dataset
Question 10 (CS2):
You need to recommend a strategy to consistently define the business unit, department, and product category data and make the data usable across reports. What should you recommend?
- A. Create a shared dataset for each standardized entity.
- B. Create dataflows for the standardized data and make the dataflows available for use in all imported datasets.
- C. For every report, create and use a single shared dataset that contains the standardized data.
- D. For the three entities, create exports of the data from the Power BI model to Excel and store the data in OneDrive.
Question 11 (CS2):
Which DAX expression should you use to get the ending balances in the balance sheet reports for the quarter?
- A. CALCULATE( SUM( BalanceSheet[BalanceAmount] ), DATESQTD( ‘Date'[Date] ))
- B. CALCULATE( SUM( BalanceSheet[BalanceAmount] ), LASTDATE( ‘Date'[Date] ))
- C. FIRSTNONBLANK ( ‘Date'[Date] SUM( BalanceSheet[BalanceAmount] ) )
- D. CALCULATE (MAX( BalanceSheet[BalanceAmount] ), LASTDATE( ‘Date'[Date] ))
Case Study 3: Northwind Traders
Question 1 (CS3):
You need to minimize the size of the dataset. The solution must meet the report requirements. What should you do?
- A. Group the Categories table by the CategoryID column.
- B. Remove the QuantityPerUnit column from the Products table.
- C. Filter out discontinued products while importing the Products table.
- D. Change the OrderID column in the Orders table to the Text data type.
Question 2 (CS3):
HOTSPOT – You need to create a relationship in the dataset for RLS, which will restrict sales employees to their assigned region. What should you do?
To see the actual exam question with images, please Download the Questions PDF.
- Between which two tables should the relationship be created: [Option]
- What is the cardinality: [Option]
- Tables: Sales Employees and Customer Details
- Cardinality: Many-to-many (on the Region column)
Question 3 (CS3):
You need to design the data model to meet the report requirements, which involve analyzing by order month/quarter and shipping month/quarter. What should you do in Power BI Desktop?
- A. From Power Query, add a date table. Create an active relationship to the OrderDate column in the Orders table and an inactive relationship to the ShippedDate column in the Orders table.
- B. From Power Query, add columns to the Orders table to calculate the calendar quarter and month of the OrderDate.
- C. From Power BI Desktop, use the Auto date/time option when creating the reports.
- D. From Power Query, use a DAX expression to add columns to the Orders table for quarter and month.
Question 4 (CS3):
You need to create the On-Time Shipping report. The report must include a visualization that shows the percentage of late orders. Which type of visualization should you create?
- A. pie chart
- B. scatterplot
- C. bar chart
Question 5 (CS3):
You need to create the dataset. Which dataset mode should you use?
- A. Import
- B. DirectQuery
- C. Composite
- D. live connection
Question 6 (CS3):
HOTSPOT – You need to create a solution to meet the notification requirements of the warehouse shipping department (notified if late orders > 5%). What should you do?
To see the actual exam question with images, please Download the Questions PDF.
- Object to create: [Option]
- Where to create it: [Option]
- Condition to set: [Option]
- Object to create: Data alert
- Where to create it: On a dashboard tile (specifically a card, KPI, or gauge)
- Condition to set: Threshold is above 0.05
Question 7 (CS3):
You need to configure access for the sales department users. The solution must meet the security requirements, which include managing permissions and publishing apps. What should you do?
- A. Add the sales department as a member of the reports workspace.
- B. Add the Azure Active Directory group of the sales department as an Admin of the reports workspace.
- C. Distribute an app to the users in the Azure Active Directory group of the sales department.
- D. Share each report to the Azure Active Directory group of the sales department.
Question 8 (CS3):
HOTSPOT – You need to create a measure that will return the percentage of late orders. How should you complete the DAX expression?
To see the actual exam question with images, please Download the Questions PDF.
% Late Orders =
DIVIDE(
  [Numerator_Calculation],
  [Denominator_Calculation]
)
- Numerator_Calculation:
CALCULATE( COUNTROWS(Orders), FILTER(Orders, Orders[ShippedDate] > Orders[RequiredDate]) ) - Denominator_Calculation:
COUNTROWS(Orders)
Question 9 (CS3):
HOTSPOT – You need to create the Top Customers report, showing the top 20 customers based on sales. Which type of filter should you use, and at which level should you apply the filter?
To see the actual exam question with images, please Download the Questions PDF.
- Filter type: [Option]
- Filter level: [Option]
- Filter type: Top N
- Filter level: Visual level
Question 10 (CS3):
HOTSPOT – You need to design the data model and the relationships for the Customer Details worksheet and the Orders table. For each of the following statements, select Yes if the statement is true. Otherwise, select No.
To see the actual exam question with images, please Download the Questions PDF.
- A relationship should be created between CustomerDetails[CustomerID] and Orders[CustomerID].
- The CustomerID column in the Orders table should be changed to a numeric data type.
- The primary key for the customer data is in the Orders table.
- A relationship should be created between CustomerDetails[CustomerID] and Orders[CustomerID]: No (The data types and values do not match. The relationship should be between `CustomerDetails[CustomerCRMID]` and `Orders[CustomerID]`).
- The CustomerID column in the Orders table should be changed to a numeric data type: No (The values like ‘VINET’ are text, so it cannot be changed to numeric).
- The primary key for the customer data is in the Orders table: No (The primary key for customer data is in the Customer Details table; it’s a foreign key in the Orders table).
Other Questions
Question 1:
Note: This question is part of a series… From Power Query Editor, you profile IoT data. You need to analyze events by hour and day of the year and improve dataset performance.
Solution: You remove the IoT GUID column and retain the IoT ID column.
Does this meet the goal?
- A. Yes
- B. No
Question 2:
DRAG DROP – You have a report with five bookmarks. You need to add an object from which users can navigate between three specific bookmarks. How should you complete the task?
To see the actual exam question with images, please Download the Questions PDF.
- In the Bookmarks pane, select the three specific bookmarks and Group them.
- From the Insert ribbon, add a Button and select the Bookmark navigator type.
- In the Format pane for the button, under the Bookmarks property, change the selection from “All” to the bookmark group you just created.
Question 3:
You import a large dataset to Power Query Editor. You need to identify whether a column contains only unique values. Which two Data Preview options can you use? Each correct answer presents a complete solution.
- A. Show whitespace
- B. Column distribution
- C. Column profile
- D. Column quality
- E. Monospaced
Question 4:
You import a dataset with a Product Inventory table containing 25 million rows. Columns include DateKey, ProductKey, MovementDate, and UnitCost. The table relates to Date via DateKey and Product via ProductKey. You need to reduce the model size without losing information. What should you do?
- A. Change Summarization for DateKey to Don’t Summarize.
- B. Change the data type of UnitCost to Integer.
- C. Remove the relationship between Date and Product Inventory.
- D. Remove MovementDate.
Question 5:
Note: This question is part of a series… You have several reports and dashboards in a workspace. You need to grant all organizational users read access to a dashboard and several reports.
Solution: You assign all the users the Viewer role to the workspace.
Does this meet the goal?
- A. Yes
- B. No
Question 6:
You are using the key influencers visual as shown in the exhibit. What can you identify from the visual?
To see the actual exam question with images, please Download the Questions PDF.
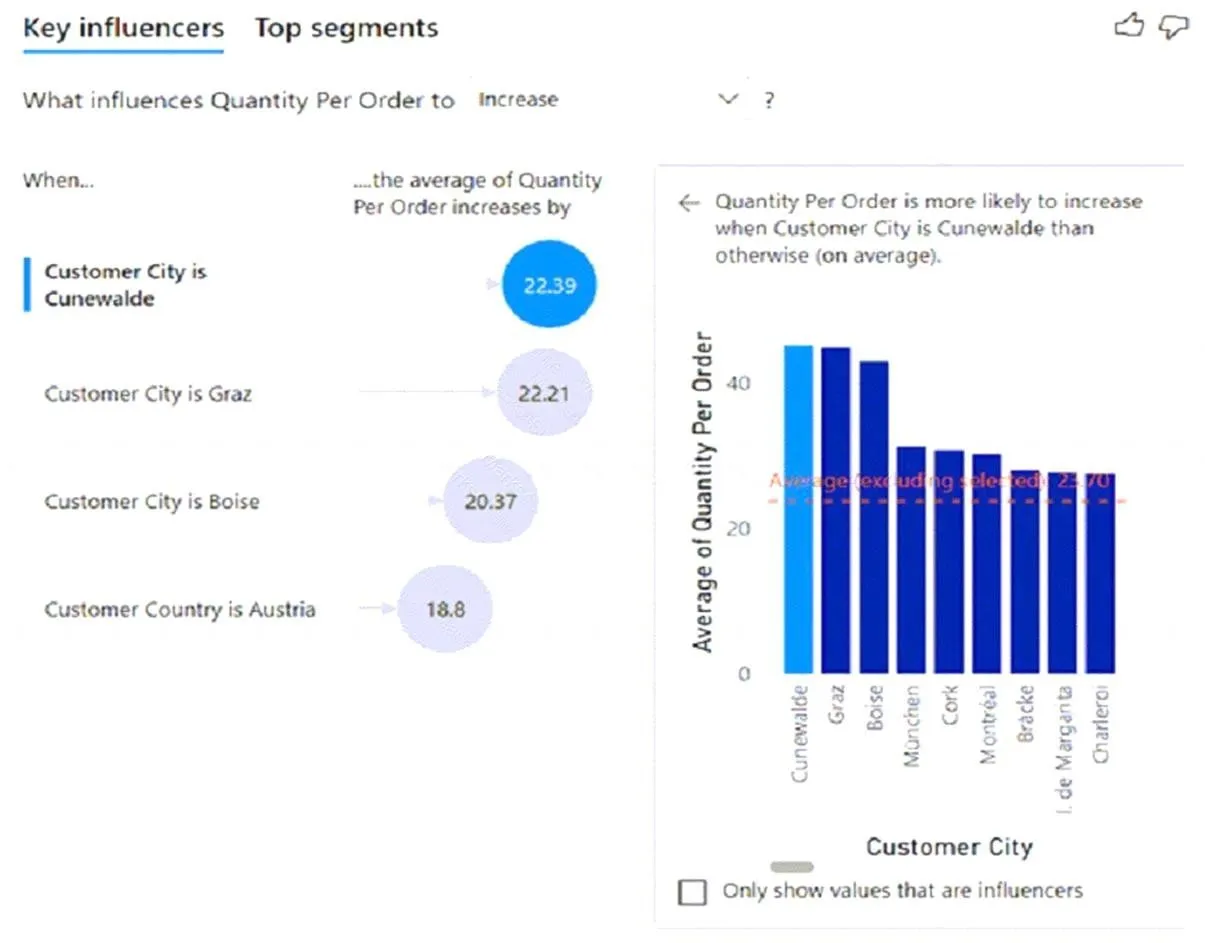
- A. Customers in Austria order 18.8 more units than the average order quantity.
- B. Customers in Boise order 20.37 percent more than the average order quantity.
- C. Product Category positively influences the quantity per order.
- D. Customers in Cork order lower quantities than average.
Question 7:
You build a Power BI report that displays IoT temperature data streaming from a refrigerator. You publish the report to the Power BI service. You need to be notified when the temperature rises above four degrees Celsius. What should you do?
- A. Set an alert on a KPI visual in the report.
- B. Pin a card visual to a dashboard and create a subscription.
- C. Pin a card visual to a dashboard and set an alert on the tile.
- D. Pin a report page to a dashboard and set an alert on the page.
Question 8:
DRAG DROP – You have a table visual with a measure named Revenue. You need to format the visual so the Revenue column displays a specific background color based on value ranges. Which three actions should you perform in sequence in Power BI Desktop?
To see the actual exam question with images, please Download the Questions PDF.
- In the formatting pane for the visual, find the Cell elements section for the Revenue column and turn on Background color.
- Click the ‘fx’ button to open the conditional formatting dialog. Set the Format style to Rules.
- Click + New rule to add and configure a separate rule for each required value range and its corresponding color.
Question 9:
You are building a Power BI report that uses data from an Azure SQL database named erp1. You import the following tables.
To see the actual exam question with images, please Download the Questions PDF.
You need to perform the following analyses: – Orders sold over time that include a measure of the total order value Orders by attributes of products sold The solution must minimize update times when interacting with visuals in the report. What should you do first?- A. From Power Query, merge the Order Line Items query and the Products query.
- B. Create a calculated column that adds a list of product categories to the Orders table by using a DAX function.
- C. Calculate the count of orders per product by using a DAX function.
- D. From Power Query, merge the Orders query and the Order Line Items query.
Ready for Offline Study?
Get the complete PL-300 question bank with detailed answers as a downloadable PDF to supercharge your exam prep.
Download Complete PDFFrequently Asked Questions (FAQ) about PL-300 Case Studies
1. How are Case Study questions different on the PL-300 exam?
Case studies present a detailed business scenario with multiple requirements (technical, security, reporting). You will then answer several questions based on that single scenario. They test your ability to synthesize information and apply your knowledge to solve a complex, multi-faceted problem.
2. What is the best strategy for tackling a case study?
First, quickly read through the entire scenario to get a general understanding. Then, read the first question. Go back to the scenario and carefully re-read the relevant sections (e.g., security requirements, data source details) to find the specific information needed to answer that question. Repeat this process for each question in the case study.
3. What is the difference between a dashboard and a report in Power BI?
A report is a multi-page, interactive deep-dive into a dataset, designed for exploration and detailed analysis. A dashboard is a single-page canvas that provides a high-level, at-a-glance view of key metrics (KPIs), often by pinning visuals from multiple different reports. Dashboards are for monitoring, while reports are for analysis.