
PL-300 Power BI Exam Questions Part 1 | Practice Test (Q1-25)
Start your PL-300 Microsoft Power BI Data Analyst exam preparation strong! This set contains questions 1-25 covering essential Power BI reports, visual configurations, and fundamental concepts.
Question 1:
You have a Power BI report. The report contains a line chart that displays sales data for several regions. You need to add an element to the report that will enable users to filter the sales data to include only a selected region. Which two elements achieve the goal? Each correct answer presents a complete solution.
- A. a slicer visual
- B. a drillthrough filter
- C. a table visual
- D. a card visual
- E. a Key Performance Indicator (KPI) visual
Question 2:
You have a Power BI report that contains the visuals shown in the following table.
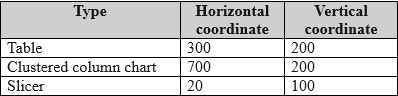
You need to modify the location of each visual. What should you modify for each visual?
- A. the layer order
- B. the padding
- C. the position
- D. the tab order
Question 3:
You have a Power BI dataset that contains quarterly sales performance data. You need to enable managers to review the data in a format that meets the following requirements:
– Is optimized for printing.
– Renders data in Microsoft Excel, Word, PowerPoint, and PDF formats.
What should you create?
- A. a template app
- B. a dashboard
- C. a paginated report
- D. an interactive report
Question 4:
You have a Power BI model that contains two tables named Population and Date… You create a table visual that displays Date[Year] and [2023 Population]. What will the table visual show?
- A. one row per year that contains blank values for every year except 2023
- B. one row per date that contains the population value for the corresponding year repeated in each row
- C. a single row for the year 2023 that contains the related population value
- D. one row per year that contains the same value repeated for each year
Question 5:
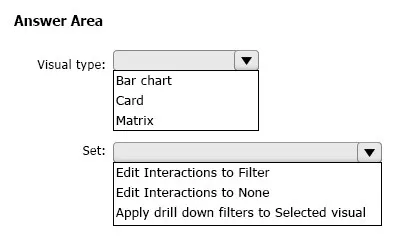
You have a Power BI report that contains a page… You need to configure the page to ensure that the card and the bar chart are unaffected when a user drills down in the matrix… What should you configure?
Question 6:
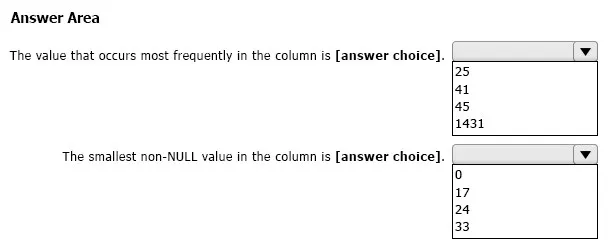
You are using Power Query Editor to preview the data in a column named Max Temp…
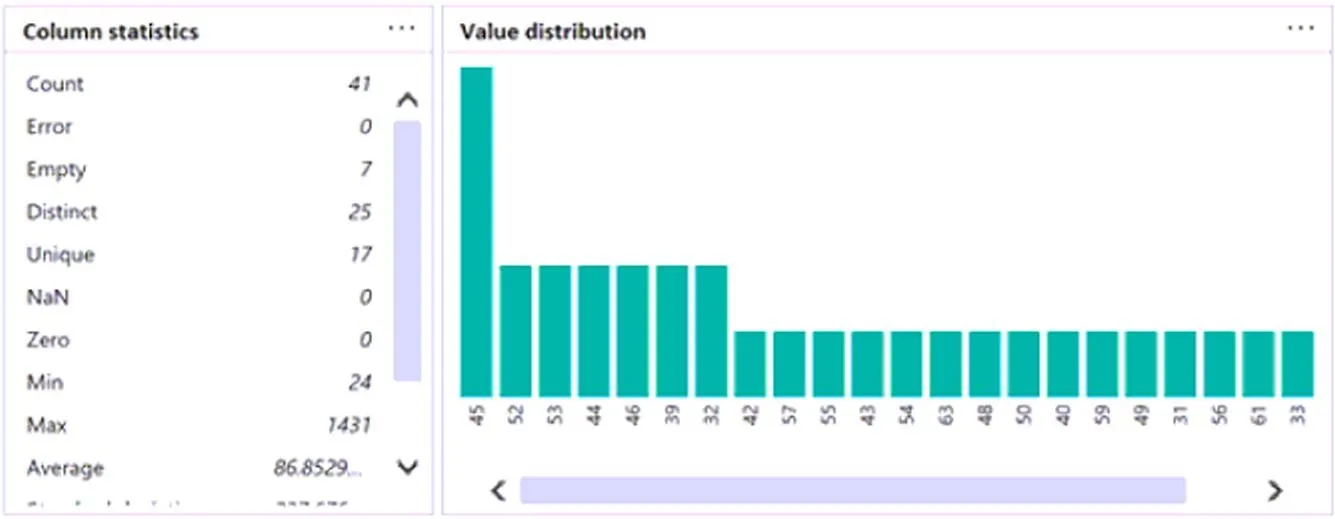
Use the drop-down menus to select the answer choice that completes each statement based on the information presented in the graphic.
Question 7:
You have a Power BI report that contains a visual… You need to ensure that the report meets the following requirements:
• All values must be set to two decimal places.
• All negative values must be displayed in red font and parentheses.
Which two actions should you perform?
- A. For the visual, apply conditional formatting to the background color.
- B. Configure the measure to use a custom format.
- C. For the visual, apply conditional formatting to the font color.
- D. For the visual, set Value decimal places to 2.
Question 8:
You have a Power BI dataset named Finance… You need to enable the finance team to use Microsoft Excel to analyze the Finance dataset. What should you do?
- A. Grant the finance team build permissions to the Finance dataset.
- B. Provide an Excel workbook that is connected to the Finance dataset.
- C. Create a row-level security (RLS) role and add the finance team to the role as members.
- D. Grant the finance team write permissions to the Finance dataset.
Question 9:
You need to create a visual that compares profit across 10 product categories for a selected quarter. What is the best visual to use to achieve the goal?
- A. an area chart
- B. a funnel chart
- C. a clustered bar chart
- D. a line chart
Question 10:
You have a Power BI report that will be rendered on a vertical display. You need to maximize the portion of the screen area used by the report. What should you do?
- A. From the Canvas background setting of Power BI Desktop, configure the Image fit setting.
- B. From the Canvas settings of Power BI Desktop, set a custom width and height.
- C. From Power BI Desktop, select Personalize visuals.
- D. From the Power BI service, enable the Pages pane.
Question 11:
You have a Power BI report named ReportA… You need to ensure that consumers of ReportA cannot export any data from visuals. Which two actions should you perform?
- A. From Power BI Desktop, modify the Report settings.
- B. From Power BI Desktop, modify the Data Load settings.
- C. From the Power BI service, modify the dataset permissions.
- D. From the Power BI service, modify the Report settings.
Question 12:
You need to use AI insights to add a column of enhanced data based on the customer feedback… Which AI insights service should you use for each output?
Question 13:
In Power BI Desktop, you are creating a report that will contain three pages. You need to create a custom tooltip page and prepare the page for use. Which three actions should you perform?
- A. For the tooltip page, set Allow use as tooltip to On.
- B. For the target page, set Allow use as tooltip to On.
- C. Configure filters on the target visual.
- D. For the tooltip page, configure filters.
- E. Add and configure visuals on the tooltip page.
Question 14:
You have a Power BI report that contains three pages named Page1, Page2, and Page3. All the pages have the same slicers. You need to ensure that all the filters applied to Page1 apply to Page1 and Page3 only. What should you do?
- A. On each page, modify the interactions of the slicer.
- B. Enable visibility of the slicers on Page1 and Page3. Disable visibility of the slicer on Page2.
- C. Sync the slicers on Page1 and Page3.
Question 15:
You have a Power BI report that contains five pages… You need to create a solution that will enable users to quickly navigate from the first page to all the other visible pages… What should you do first?
- A. Add a blank button to page 1.
- B. Add a page navigation button to page 1.
- C. Create a bookmark for each page.
- D. Add a bookmark navigation button to page 1.
Question 16:
You build a Power BI report that displays IoT temperature data streaming from a refrigerator… You need to be notified when the temperature rises above four degrees Celsius. What should you do?
- A. Set an alert on a KPI visual in the report.
- B. Pin a card visual to a dashboard and create a subscription.
- C. Pin a card visual to a dashboard and set an alert on the tile.
- D. Pin a report page to a dashboard and set an alert on the page.
Question 17:
You need to create a Power BI theme that will be used in multiple reports… What should you do?
- A. From Power BI Desktop, customize the current theme.
- B. From Power BI Desktop, use a built-in report theme.
- C. Create a theme as a PBIVIZ file and import the theme into Power BI Desktop.
- D. Create a theme as a JSON file and import the theme into Power BI Desktop.
Question 18:
You have a Power BI report that contains one page… You need to ensure that users can perform the following tasks for all three visuals: Switch the measures used in the visuals, Change the visualization type, Add a legend… What should you do?
- A. Create a bookmark for each acceptable combination of visualization type, measure, and legend in the bar chart.
- B. Edit the interactions between the three visuals.
- C. Enable personalization for the report.
- D. Enable personalization for each visual.
Question 19:
You have a clustered bar chart that contains a measure named Salary… You need to create a reference line to show which employees are above the median salary. Solution: You create a median line by using the Salary measure. Does this meet the goal?
- A. Yes
- B. No
Question 20:
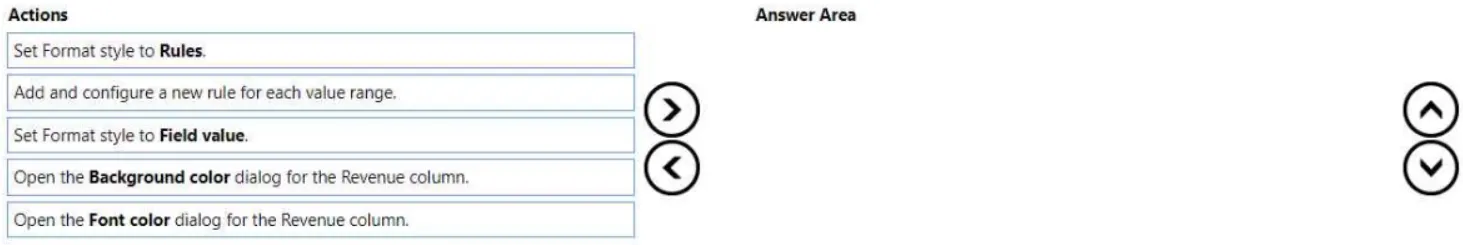
You have a Power BI report that contains a table visual with a measure named Revenue… You need to format the visual so that the Revenue column displays a specific background color based on the value range… Which three actions should you perform in sequence?
Question 21:
You have a Power BI report that contains four pages. All the pages contain a slicer for a field named Country… You need to ensure that when a user selects a country on page 1, the selection is retained on page 2 and page 3… What should you do?
- A. Remove the Country slicer from page 1, page 2, and page 3. Add the Country field to the page-level filters.
- B. Remove the Country slicer from page 1, page 2, and page 3. Add the Country field to the report-level filters.
- C. Move the Country slicer from page 2 and page 3 to page 1.
- D. Sync the Country slicer on page 1, page 2, and page 3.
Question 22:
You use Power BI Desktop to create a Power BI data model and a blank report. You need to add the Word Cloud visual shown in the following exhibit to the report…
Which three actions should you perform in sequence?
Question 23:
You have a Power BI report that contains five bookmarks. You need to add an object to the report from which users can navigate between three specific bookmarks. How should you complete the task?
Question 24:
You plan to use Power BI to create sales invoices for customers. The solution must meet the following requirements: Sales invoices must be exported in a PDF format. The PDF exports must show all columns and rows clearly. What should you create?
- A. a paginated report that contains a tablix
- B. a dashboard that contains a table
- C. an interactive report that contains a table
- D. an interactive report that contains a matrix
Question 25:
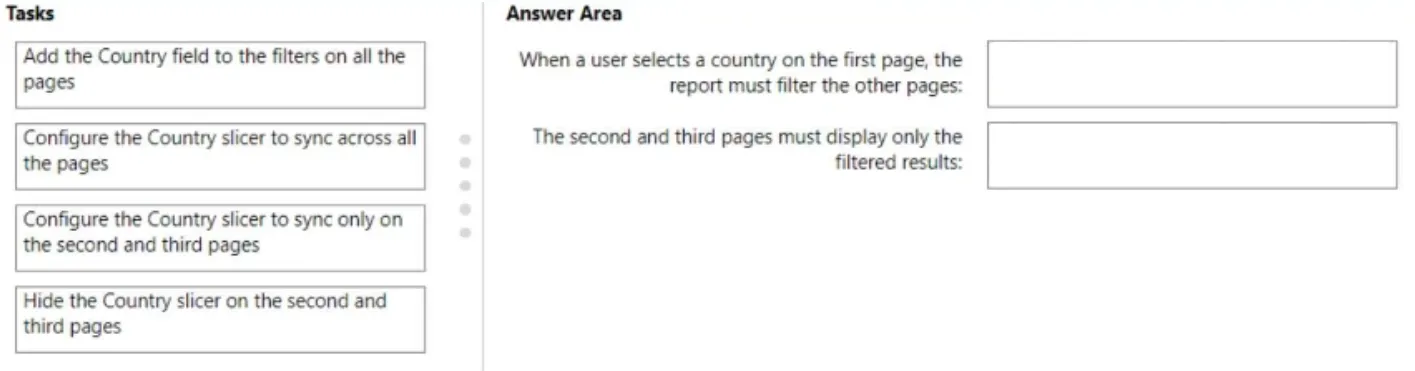
You have a Power BI report that contains three pages. The pages are used to analyze sales across various countries… Which task should you perform for each requirement?
Ready for Offline Study?
Get the complete PL-300 question bank with detailed answers as a downloadable PDF to supercharge your exam prep.
Download Complete PDFFrequently Asked Questions (FAQ) about the PL-300 Exam
1. What is the passing score for the PL-300 exam?
The passing score for the PL-300 Microsoft Power BI Data Analyst exam is 700 out of 1000. It’s important to aim higher during practice to ensure you pass comfortably.
2. Which topics are most important for the PL-300 exam?
The exam is heavily weighted on “Model the data” (25-30%) and “Visualize and analyze the data” (25-30%). However, you must have strong knowledge across all areas, including preparing data and deploying assets.
3. Is DAX difficult to learn for the PL-300 exam?
DAX can be challenging, but for the PL-300, you need a solid understanding of fundamental concepts like CALCULATE, filter context, time intelligence functions, and basic aggregations. Mastering these core functions is key.