
PL-300 Exam Questions Part 5 | Advanced Modeling & RLS (Q101-125)
Deep dive into complex PL-300 topics with questions 101-125. This set will test your knowledge of advanced data modeling, relationship types, Row-Level Security (RLS), and optimizing large datasets in Power BI.
Question 101:
HOTSPOT – You have a Power BI report named Orders that supports analysis of total sales, order counts, and new/repeat customers. The data model size is nearing its limit. The model view and data view for the dataset are shown in the exhibits. For each of the following statements, select Yes if the statement is true, Otherwise, select No.
Note: This question has been adapted for a text-based format. To see the actual exam question with images, please refer to the original source document.
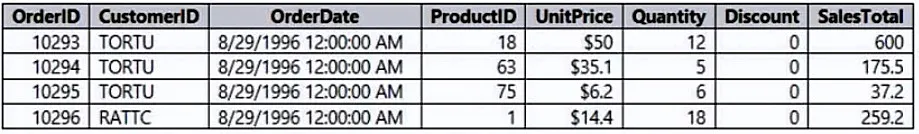
- Summarizing the Orders table by CustomerID, OrderID, and OrderDate will reduce the number of rows.
- Removing the OrderID column will significantly reduce the model size.
- Replacing the OrderDate column with a MonthID integer column will reduce the model size.
Question 102:
DRAG DROP – You receive revenue data from an Excel source that needs to be cleaned in Power Query, as shown in the exhibit. You need to transform the data to enable visuals that show revenue by year and product. The solution must ensure columns are named appropriately. Which three actions should you perform in sequence?
Note: This question has been adapted for a text-based format. To see the actual exam question with images, please refer to the original source document.
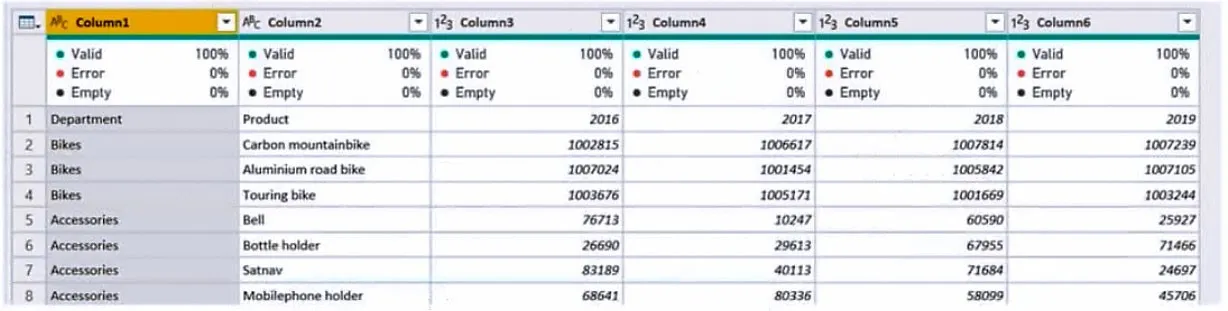
- Select Use First Row as Headers to promote the product names to column headers.
- Select the Department and Product columns, and then select Unpivot Other Columns. This will transform the year columns into two new columns: ‘Attribute’ (containing the year) and ‘Value’ (containing the revenue).
- Rename the ‘Attribute’ column to YEAR and the ‘Value’ column to REVENUE for clarity.
Question 103:
Note: This question is part of a series… You have a Power BI report with a sales table that has three date keys (Due Date, Order Date, Delivery Date). You need to support analysis of sales over time based on all three dates.
Solution: From Power Query Editor, you rename the date query as Due Date. You reference the Due Date query twice to make the queries for Order Date and Delivery Date.
Does this meet the goal?
- A. Yes
- B. No
Question 104:
Note: This question is part of a series… You have a Power BI report with a sales table that has three date keys. You need to support analysis of sales over time based on all three dates.
Solution: For each date foreign key, you add inactive relationships between the sales table and the date table.
Does this meet the goal?
- A. Yes
- B. No
Question 105:
Note: This question is part of a series… You are modeling data from a large SQL Server table named Order with over 100 million records. During development, you need to import a sample of the data from the Order table.
Solution: You add a report-level filter that filters based on the order date.
Does this meet the goal?
- A. Yes
- B. No
Question 106:
You import a dataset with a Product Inventory table containing 25 million rows. The table has columns: DateKey, ProductKey, MovementDate, and UnitCost. You need to reduce the size of the data model without losing information. What should you do?
- A. Change Summarization for DateKey to Don’t Summarize.
- B. Remove the relationship between Date and Product Inventory.
- C. Change the data type of UnitCost to Integer.
- D. Remove MovementDate.
Question 107:
HOTSPOT – You are creating a data model with Products and ProductCategory tables. Each product has one product category. You need to ensure that you can analyze sales by product category. How should you configure the relationship from ProductCategory to Products?
Note: This question has been adapted for a text-based format. To see the actual exam question with images, please refer to the original source document.
- Cardinality: [Option]
- Cross filter direction: [Option]
Question 108:
You have tables for Impressions (30 million records/month), Ads, and Campaigns. You need to create an ad analytics system to present impression counts by day, campaign, and site_name for the last year, while minimizing the data model size. Which two actions should you perform?
- A. Create one-to-many relationships between the tables.
- B. Group the Impressions query in Power Query by Ad_id, Site_name, and Impression_date. Aggregate by using the CountRows function.
- C. Create a calculated table that contains Ad_id, Site_name, and Impression_date.
- D. Create a calculated measure that aggregates by using the COUNTROWS function.
Question 109:
HOTSPOT – You have a Power BI report with the following DAX measure:
Accounts := CALCULATE ( DISTINCTCOUNT (Balances[AccountID]), LASTDATE ('Date'[Date]) )
For each of the following statements, select Yes if the statement is true. Otherwise, select No.
Note: This question has been adapted for a text-based format. To see the actual exam question with images, please refer to the original source document.
- The measure calculates the number of accounts on the last date of the filter context.
- The measure is a semi-additive measure.
- The measure can be used to show a trend of account balances over time.
Question 110:
HOTSPOT – You have a column named UnitsInStock as shown in the exhibit. UnitsInStock has 75 non-null values, of which 51 are unique. Use the drop-down menus to select the answer choice that completes each statement based on the information presented in the graphic.
Note: This question has been adapted for a text-based format. To see the actual exam question with images, please refer to the original source document.
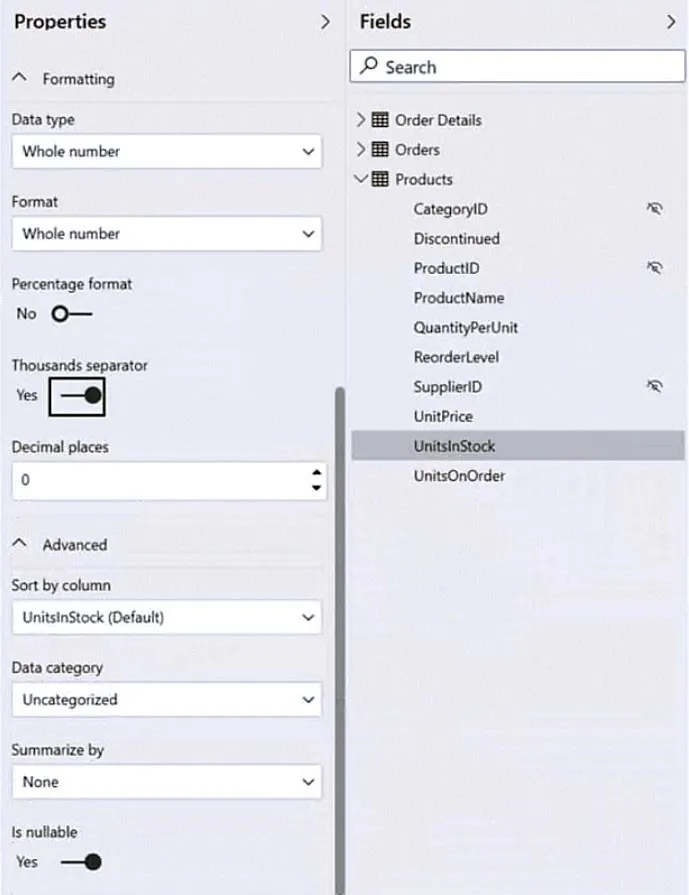
- The number of distinct values is: [Option]
- The percentage of non-unique values is: [Option]
Question 111:
In Power BI Desktop, you are building a sales report that contains two tables. Both tables have row-level security (RLS) configured. You need to create a relationship between the tables. The solution must ensure that bidirectional cross-filtering honors the RLS settings. What should you do?
- A. Create an inactive relationship between the tables and select Apply security filter in both directions.
- B. Create an active relationship between the tables and select Apply security filter in both directions.
- C. Create an inactive relationship between the tables and select Assume referential integrity.
- D. Create an active relationship between the tables and select Assume referential integrity.
Question 112:
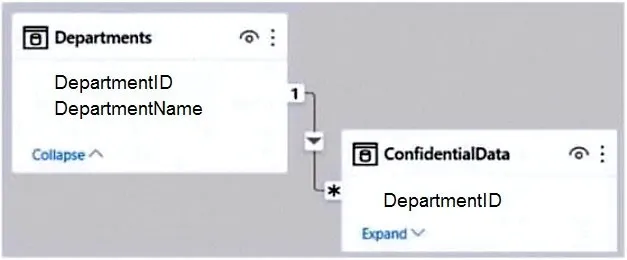
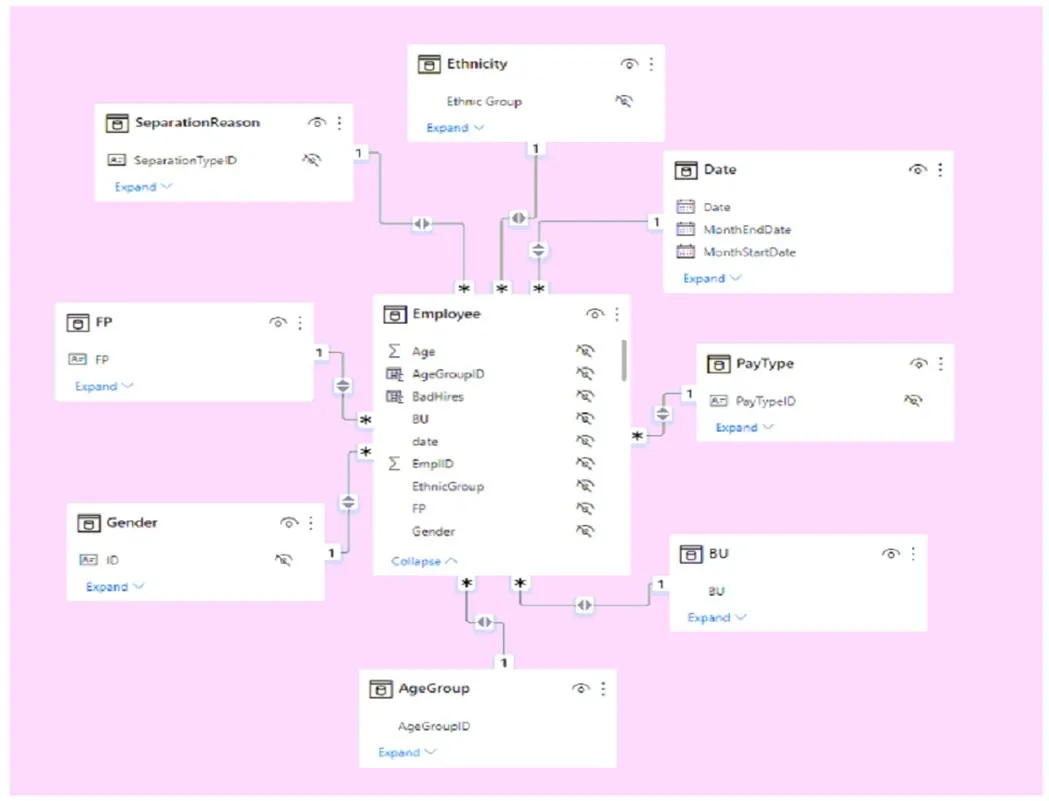
You have the Power BI model shown in the exhibit, with Departments and ConfidentialData tables. You need to ensure that users can see the data of their respective department only. What should you do?
- A. Create a slicer that filters Departments based on DepartmentID.
- B. Create a row-level security (RLS) role for each department, and then define the membership of the role.
- C. Create a DepartmentID parameter to filter the Departments table.
- D. To the ConfidentialData table, add a calculated measure that uses the CURRENTGROUP DAX function.
Question 113:
HOTSPOT – You are designing a star schema data model for school attendance from two Azure SQL database views. You need to facilitate analysis of class counts by period, student attendance by day/period, and average student attendance by month. In which table should you include the Teacher First Name and Period Number fields?
Note: This question has been adapted for a text-based format. To see the actual exam question with images, please refer to the original source document.
- Teacher First Name belongs in the: [Table Option]
- Period Number belongs in the: [Table Option]
Question 114:
HOTSPOT – You are creating an analytics report consuming data from an employees table and a sales table. There are no reporting requirements on employee_id and employee_photo. You need to optimize the data model. What should you configure for employee_id and employee_photo?
Note: This question has been adapted for a text-based format. To see the actual exam question with images, please refer to the original source document.
- For employee_id, you should: [Option]
- For employee_photo, you should: [Option]
Question 115:
DRAG DROP – You are preparing a financial report from an Excel spreadsheet as shown in the exhibit. You need to prepare the data to support visualizations of all measures over time and year-over-year calculations. Which four actions should you perform in sequence?
Note: This question has been adapted for a text-based format. To see the actual exam question with images, please refer to the original source document.
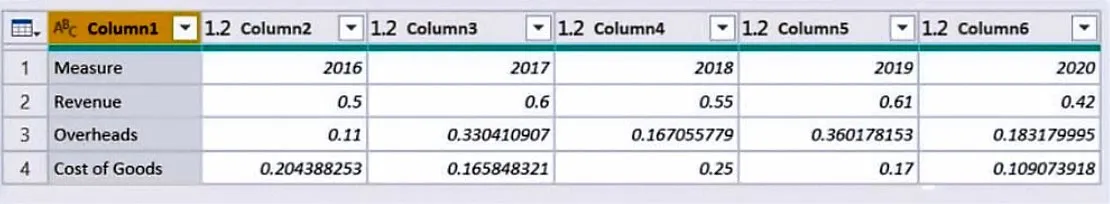
- Select Use First Row as Headers.
- Select the “Measure” column, and then select Unpivot Other Columns.
- Rename the new “Attribute” column to “Year”.
- Change the data type of the “Year” column to Whole Number or Text (depending on use). A date table should then be used for time intelligence.
Question 116:
Note: This question is part of a series… You are modeling data from a large SQL Server table with over 100 million records. During development, you need to import a sample of the data.
Solution: You add a WHERE clause to the SQL statement.
Does this meet the goal?
- A. Yes
- B. No
Question 117:
Note: This question is part of a series… You are modeling data from a large SQL Server table with over 100 million records. During development, you need to import a sample of the data.
Solution: [This appears to be a duplicate of Question 116 with a potentially different answer in the source, which might indicate a typo in the document. The previous answer (A) is correct. If the intended solution here was different, it’s missing from the text.]
Does this meet the goal?
- A. Yes
- B. No
Question 118:
You have a Power BI model with two RLS roles, Role1 and Role2. Role1 filters for State Province = “Kentucky”. Role2 filters for Calendar Year = 2020. If a user is a member of both Role1 and Role2, what data will they see?
- A. The user will see data for which the State Province value is Kentucky OR where the Calendar Year is 2020.
- B. The user will receive an error and will not be able to see the data in the report.
- C. The user will only see data for which the State Province value is Kentucky.
- D. The user will only see data for which the State Province value is Kentucky AND the Calendar Year is 2020.
Question 119:
HOTSPOT – How should you distribute the reports to the board? To answer, select the appropriate options in the answer area.
Note: This question has been adapted for a text-based format. To see the actual exam question with images, please refer to the original source document.
- Distribution method: [Option]
- Audience configuration: [Option]
Question 120:
You have a Microsoft Power BI report. The PBIX file is 550 MB. The report is a single page that contains 25 visuals. Users say that the report is slow to load. You need to recommend a solution to improve performance. What should you recommend?
- A. Change any DAX measures to use iterator functions.
- B. Enable visual interactions.
- C. Replace the default visuals with AppSource visuals.
- D. Split the visuals onto multiple pages.
Question 121:
DRAG DROP – You are denormalizing a data model into a single table. You have tables for Sales_Region, Region_Manager, and Manager. You need to merge these three tables, ensuring only managers associated with a sales region are included. Which three actions should you perform in sequence?
Note: This question has been adapted for a text-based format. To see the actual exam question with images, please refer to the original source document.
- Merge Region_Manager and Manager by using an inner join. (This links region managers to their manager details).
- Merge Sales_Region and the result of the previous step by using an inner join. (This links sales regions to their manager details).
- Merge Sales_Manager and the result of the previous step by using an inner join. (This links sales managers into the combined table).
Question 122:
You need to create the On-Time Shipping report. The report must include a visualization that shows the percentage of late orders. Which type of visualization should you create?
- A. pie chart
- B. scatterplot
- C. bar chart
Question 123:
HOTSPOT – You have a Power BI model with a Sales table and a related Date table. Sales contains a measure named Total Sales. You need to create a measure that calculates the total sales from the equivalent month of the previous year. How should you complete the calculation?
Sales PMY = [Function1]([Measure], [Function2]('Date'[Date]))
- Function1: [Option]
- Function2: [Option]
Question 124:
HOTSPOT – You have a Power BI imported dataset that contains the data model shown in the following exhibit. Use the drop-down menus to select the answer choice that completes each statement based on the information presented in the graphic.
Note: This question has been adapted for a text-based format. To see the actual exam question with images, please refer to the original source document.
- The relationship property that should be set to Single is: [Option]
- The data model design pattern is a: [Option]
Question 125:
You have the Power BI model shown in the exhibit. A manager can represent only a single country. You need to use RLS to ensure managers see only the data of their respective country, while minimizing the number of RLS roles. Which two actions should you perform?
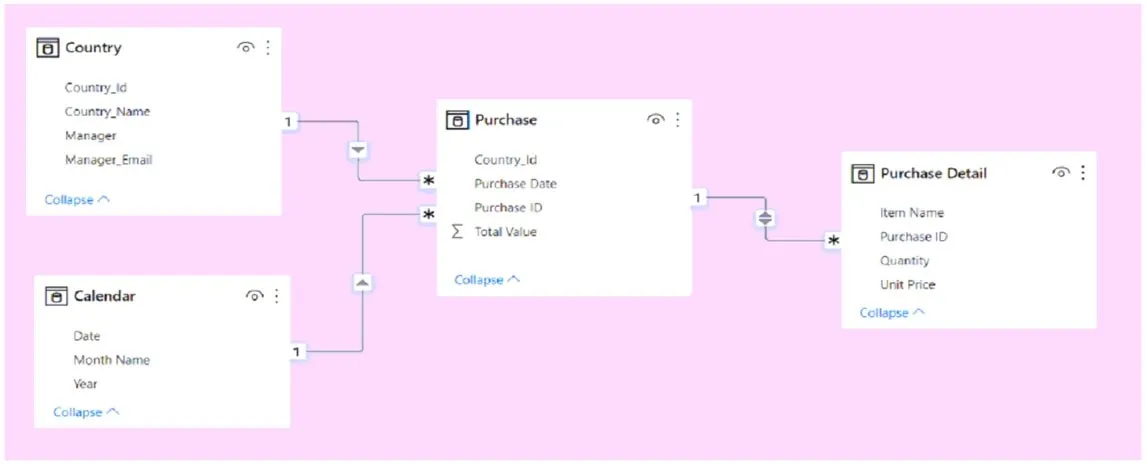
- A. Create a single role that filters Country[Manager_Email] by using the USERNAME() DAX function.
- B. Create a single role that filters Country[Manager_Email] by using the USEROBJECTID() DAX function.
- C. For the relationship between Purchase Detail and Purchase, select Apply security filter in both directions.
- D. Create one role for each country.
- E. For the relationship between Purchase and Purchase Detail, change the Cross filter direction to Single.
Ready for Offline Study?
Get the complete PL-300 question bank with detailed answers as a downloadable PDF to supercharge your exam prep.
Download Complete PDFFrequently Asked Questions (FAQ) about Advanced Modeling & RLS
1. What is dynamic Row-Level Security (RLS) in Power BI?
Dynamic RLS is a powerful technique where a single security role can show different data to different users. It typically uses DAX functions like `USERPRINCIPALNAME()` or `USERNAME()` to filter the data based on the logged-in user’s identity, which is looked up in a security or employee table.
2. What is a “role-playing dimension” in data modeling?
A role-playing dimension is when a single dimension table (like a Date table) is used to filter a fact table on multiple foreign keys (e.g., Order Date, Ship Date, Due Date). This is achieved by creating multiple, independent relationships between the tables, one for each “role” the date plays.
3. How do you handle many-to-many relationships in Power BI?
While Power BI supports direct many-to-many relationships, the best practice for the PL-300 is often to resolve them by creating a “bridge” or “linking” table. This table sits between the two original tables and contains unique pairs of keys, converting the many-to-many relationship into two one-to-many relationships, which is more performant and less ambiguous.