
PL-300 Practice Test Part 4 | Model Optimization & DAX Measures (Q76-100)
Advance your PL-300 Power BI exam preparation. Tackle questions 76-100, focusing on critical data model optimization techniques, performance tuning, and writing effective DAX measures for analysis.
Question 76:
You have a Microsoft Power BI report. The size of the PBIX file is 550 MB. The report uses an imported dataset with 12 million rows. The report is a single page containing 25 visuals. Users say that the report is slow to load and interact with. You need to recommend a solution to improve performance. What should you recommend?
- A. Replace the default visuals with AppSource visuals.
- B. Remove unused columns from tables in the data model.
- C. Change the imported dataset to DirectQuery.
- D. Increase the number of times that the dataset is refreshed.
Question 77:
You have a CSV file that contains user complaints. The file contains a column named Logged, with data in the format: 2018-12-31 at 08:59. You need to be able to analyze the complaints by the logged date and use a built-in date hierarchy. What should you do?
- A. Change the data type of the Logged column to Date.
- B. Split the Logged column by using ” at ” as the delimiter.
- C. Add a conditional column that outputs 2018 if the Logged column starts with 2018.
- D. Apply the Parse function from the Date transformations options to the Logged column.
Question 78:
You have a Power BI report that contains a page with a shape (Shape1), a card (Sales Summary), and a bar chart (Sales by Region). You need to ensure that Sales Summary renders on top of Shape1. What should you modify?
- A. Tab order in the Selection pane
- B. Layer order in the Selection pane
- C. Maintain layer order in the General visual settings
- D. Vertical alignment in the Canvas settings
Question 79:
HOTSPOT – You have the Power BI data model shown in the exhibit. The data model must support analysis of total sales by product by order month, quantities sold by order day, and number of sales transactions by order quarter. For each of the following statements, select Yes if the statement is true. Otherwise, select No.
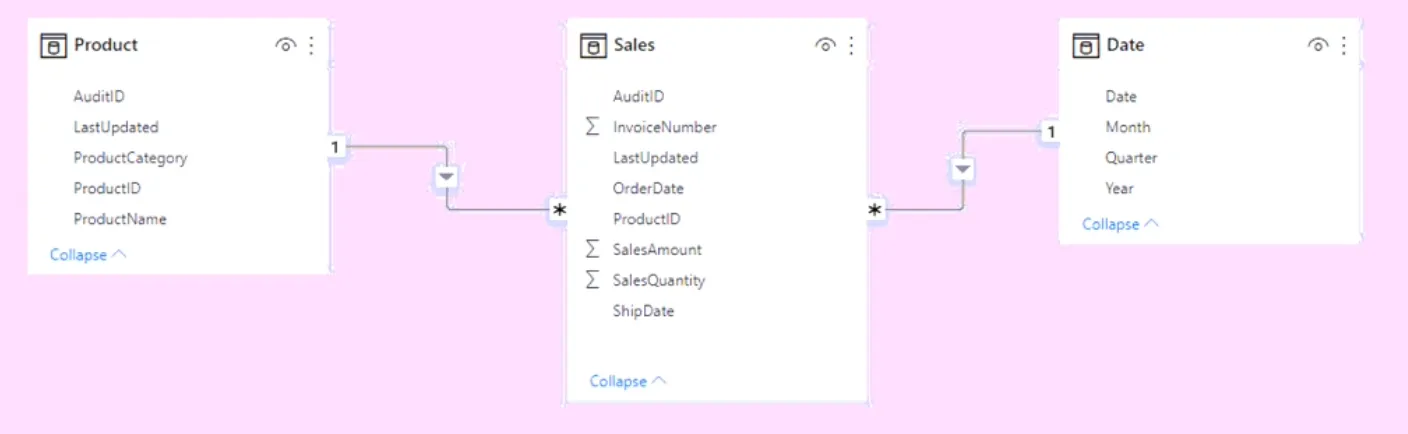
- Auto date/time is enabled.
- You can analyze sales by order date.
- The model size is optimized.
Question 80:
You have a CSV file that contains user complaints. The file contains a column named Logged in the format: 2018-12-31 at 08:59. You need to analyze the complaints by the logged date and use a built-in date hierarchy. What should you do?
- A. Create a column by example that starts with 2018-12-31 and set the data type of the new column to Date.
- B. Create a column by example that starts with 2018-12-31.
- C. Apply a transformation to extract the last 11 characters of the Logged column.
- D. Add a conditional column that outputs 2018 if the Logged column starts with 2018.
Question 81:
You are implementing dynamic row-level security (RLS) in a Power BI data model. You need to create a table filter to ensure users see only their own employee data. The DAX expression must work in both Power BI Desktop and the Power BI service. Which expression should you use?
- A. [Email Address] – USERNAME()
- B. [Employee Name] – USERPRINCIPALNAME()
- C. [Employee Name] = USERNAME()
- D. [Email Address] = USERPRINCIPALNAME()
Question 82:
You are building a data model and use Power Query to load a query that contains renamed and custom columns. Later, you attempt to reload the query and receive the error: “Expression.Error: The column ‘Category’ of the table wasn’t found.” What are two possible causes of the error?
- A. The column was removed from the source file.
- B. The column was renamed in the source file.
- C. The file is no longer in the specified location.
- D. The data type of the column was changed.
Question 83:
You have data formatted as shown in a table with a ‘Machine-User’ column. You need to create a clustered bar chart that separates Machine and User, as shown in the exhibit. What should you do?
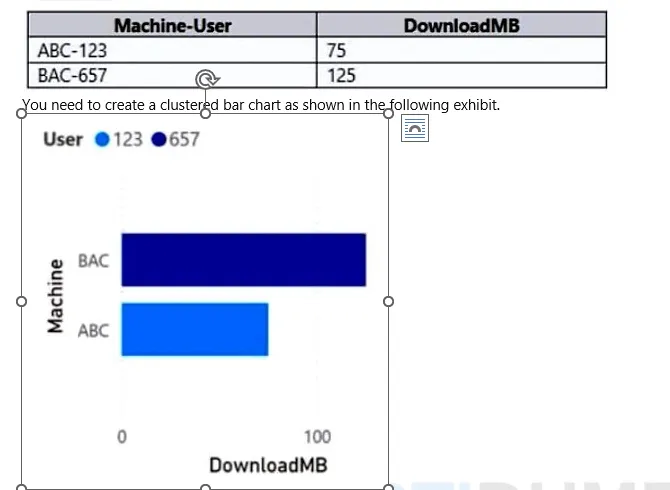
- A. From Power Query Editor, split the Machine-User column by using a delimiter.
- B. From Power Query Editor, create a column that contains the last three digits of the Machine-User column.
- C. In a DAX function, create two calculated columns named Machine and User by using the SUBSTITUTE function.
- D. In a DAX function, create two measures named Machine and User by using the SUBSTITUTE function.
Question 84:
DRAG DROP – You need to create a date table in Power BI that must contain 10 full calendar years, including the current year. How should you complete the DAX expression?
Date = CALENDAR( DATE(YEAR(TODAY()) - 9, 1, 1), DATE(YEAR(TODAY()), 12, 31) )
Fill in the blanks for a similar expression using different functions.
Question 85:
Note: This question is part of a series of questions that present the same scenario.
You have a Power BI report with a sales table that has three date keys. You need to support analysis based on all three dates.
Solution: You create measures that use the USERELATIONSHIP DAX function to filter sales on the active relationship between the sales table and the date table.
Does this meet the goal?
- A. Yes
- B. No
Question 86:
HOTSPOT – You have a Power BI report that contains a measure named Total Sales. You need to create a new measure that will return the sum of Total Sales for a year up to a selected date. How should you complete the DAX expression?
Sales YTD = [Function1]([Measure], [DateColumn])
- Function1: [Option]
- Measure: [Option]
- DateColumn: [Option]
Question 87:
DRAG DROP – You have a Sales table and a Transaction Size table. You need to create a calculated column in Sales to classify each transaction as small, medium, or large based on the Sales Amount. How should you complete the code?
=CALCULATE( VALUES('Transaction Size'[Category]), [Filter_Expression] )
Question 88:
You have a Power BI report for the procurement department with a Suppliers table and a LineItems table. The report contains visuals for Supplier Name, Invoice Count, and Total Price. You need to minimize the size of the dataset without affecting the visuals. What should you do?
- A. Merge Suppliers and LineItems.
- B. Remove the LineItems[Description] column.
- C. Remove the rows from LineItems where LineItems[Invoice Date] is before the beginning of last month.
- D. Group LineItems by LineItems[Invoice ID] and LineItems[Invoice Date] with a sum of LineItems[Price].
Question 89:
You have a Power BI report for marketing with a Posts table and a Traffic table. The dataset takes a long time to refresh. You need to modify the queries to reduce load times. Which two actions will reduce the load times?
- A. Remove the rows in Posts in which Posts[Publish Date] is in the last seven days.
- B. Remove the rows in Traffic in which Traffic[URL Visited] does not contain "blog".
- C. Remove Traffic[IP Address], Traffic[Browser Agent], and Traffic[Referring URL].
- D. Remove Posts[Full Text] and Posts[Summary].
- E. Remove the rows in Traffic in which Traffic[Referring URL] does not start with "/".
Question 90:
HOTSPOT - You are creating a quick measure as shown in the exhibit. You need to create a monthly rolling average measure for Sales over time. How should you configure the quick measure calculation?
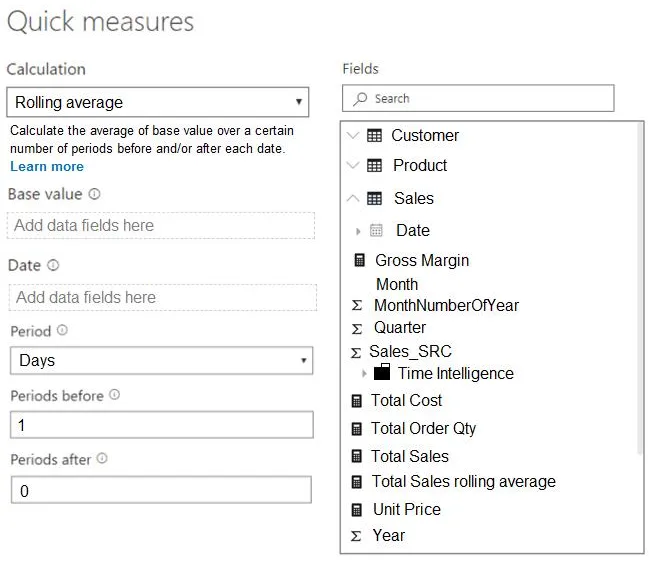
- Base value: [Option]
- Date: [Option]
- Period: [Option]
- Number of periods: [Option]
Question 91:
You have the Power BI data model shown in the exhibit. The Sales table contains records from the last five years. You plan to create a measure to return the total sales of March 2021 when March 2022 is selected. Which DAX expression should you use?
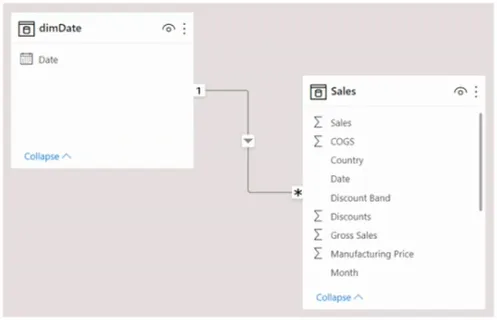
- A. CALCULATE(SUM(Sales[Sales]), PREVIOUSYEAR(dimDate[Date]))
- B. TOTALYTD(SUM(Sales[Sales]), dimDate[Date])
- C. CALCULATE(SUM(Sales[Sales]), SAMEPERIODLASTYEAR(dimDate[Date]))
- D. SUM(Sales[Sales])
Question 92:
You use Power BI Desktop to load data from a SQL Server database. While waiting for the data to load, you receive a timeout error. You need to resolve the error. What are two ways to achieve the goal?
- A. Reduce the number of rows and columns returned by each query.
- B. Split long-running queries into subsets of columns and use Power Query to merge the queries.
- C. Use Power Query to combine long-running queries into one query.
- D. Disable query folding on long running queries.
Question 93:
Note: This question is part of a series... From Power Query Editor, you profile IoT data. You need to analyze events by hour and day of the year and improve performance.
Solution: You split the IoT DateTime column into a column named Date and a column named Time.
Does this meet the goal?
- A. Yes
- B. No
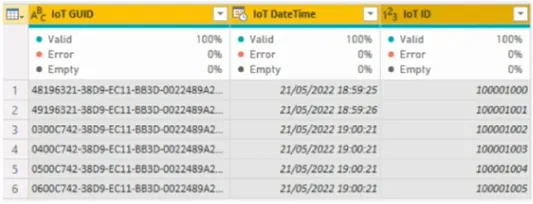
Question 94:
Note: This question is part of a series... From Power Query Editor, you profile IoT data. You need to analyze events by hour and day of the year and improve performance. The IoT GUID and IoT ID columns are unique to each row.
Solution: You remove the IoT GUID column and retain the IoT ID column.
Does this meet the goal?
- A. Yes
- B. No
Question 95:
Note: This question is part of a series... From Power Query Editor, you profile IoT data. You need to analyze events by hour and day of the year and improve performance.
Solution: You change the IoT DateTime column to the Date data type.
Does this meet the goal?
- A. Yes
- B. No
Question 96:
DRAG DROP - You have a data model with a Products table and a Sales table. You have a report-level filter on Products. You need to create a measure that will return the percent of total sales for each product, respecting the report-level filter when calculating the total. How should you complete the DAX measure?
% of Total Sales = DIVIDE( SUM(Sales[SalesAmount]), [Function1](SUM(Sales[SalesAmount]), [Function2](Products)) )
Question 97:
You are creating a sales report in Power BI. You have a Store table with columns for City, State/Province, and Country. You plan to create a map visual that will show store locations and provide the ability to drill down from Country to State/Province to City. What should you do to ensure that the locations are mapped properly?
- A. Change the data type of City, State/Province, and Country.
- B. Set Summarization for City, State/Province, and Country to Don't summarize.
- C. Set the data category of City, State/Province, and Country.
- D. Create a calculated column that concatenates the values in City, State/Province, and Country.
Question 98:
You are creating a sales report for the NorthWest region from a SQL Server view. The report requires analysis of order count, total sales by date, customer count, and average quantity per order. You need to reduce data refresh and report query times. Which two actions should you perform?
- A. Set the data type for SalesOrderNumber to Decimal Number.
- B. Remove the CustomerKey and ProductKey columns.
- C. Remove the TaxAmt and Freight columns.
- D. Filter the data to only the NorthWest region sales territory.
Question 99:
DRAG DROP - You are creating a Power BI model. You have a single table named Product with fields for ID, Name, Color, Category, and Total Sales. You need to create a calculated table that shows only the top 8 products based on the highest value in Total Sales. How should you complete the DAX expression?
Top 8 Products = [Function1](8, [Table], [OrderByExpression], [Order])
Question 100:
HOTSPOT - You are building a financial report. You have a table named financials with Date and Sales columns. You need to create a measure that calculates the relative change in sales as compared to the previous quarter. How should you complete the measure?
VAR PreviousQuarter = CALCULATE([Total Sales], [Function]('financials'[Date]))
RETURN DIVIDE(([Total Sales] - PreviousQuarter), PreviousQuarter)
- Function: [Option]
Ready for Offline Study?
Get the complete PL-300 question bank with detailed answers as a downloadable PDF to supercharge your exam prep.
Download Complete PDFFrequently Asked Questions (FAQ) about Model Optimization
1. Why is reducing data model size important in Power BI?
A smaller data model consumes less memory, leading to faster report loading, quicker visual interactions, and more efficient data refreshes. It's a critical aspect of Power BI performance tuning, especially in shared capacity.
2. What is a "star schema" and why is it recommended for Power BI?
A star schema is a data modeling approach where a central "fact" table (containing numbers, like sales amounts) is surrounded by multiple "dimension" tables (containing descriptive attributes, like products or dates). This structure is highly optimized for performance and makes writing DAX measures much more intuitive.
3. What are some quick ways to optimize a Power BI model for the PL-300 exam?
Key techniques include: removing unused columns in Power Query, ensuring correct data types (e.g., using whole numbers instead of text for keys), disabling "Auto date/time" and using a dedicated date table, and avoiding unnecessary bidirectional relationships.